Interactive Web Tools
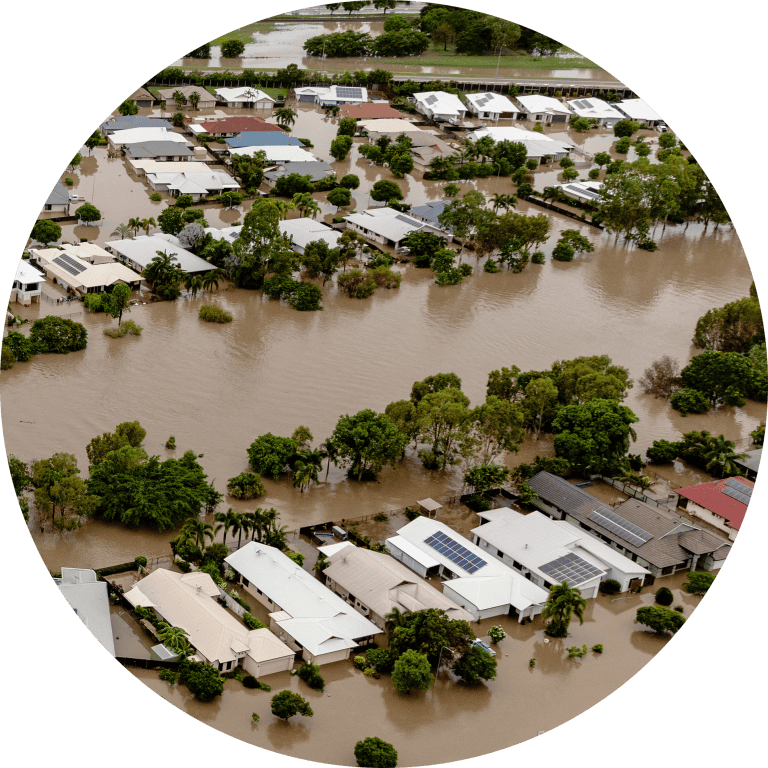
Flood Risk and Vulnerability Dashboard
Program:
The goal of this project is to identify buyout-induced relocation patterns and evaluate the localized fiscal, social, and hazard impacts of property buyouts in the Houston Metro Area, Texas. In collaboration with local stakeholders, the research team has developed a GIS-based dashboard focused on historical buyouts in Harris County. The tool maps and analyzes buyouts in terms of flood risk and social vulnerability at both the origin and destination block groups, and includes information on average distances to where the buyout participants have relocated.
M3FR: Measuring, Mapping and Managing Flood Risk
Program:
M3FR aims to improve flood risk communication by integrating multiple types of flood risk and hazard models and leveraging risk communication best practices. In its initial year of funding, M3FR created a comprehensive catalog of commonly used flood hazard models in the United States. This catalog highlights key characteristics of each model that are relevant to the needs of decision makers, emphasizing practical utility to serve as effective guidelines for disaster management and flood-related issues.
DMQT: Data & Models Query Tool
Program:
The Texas Disaster Information System (TDIS) is a comprehensive data platform designed to support natural disaster management in Texas. Through collaborative efforts, TDIS aims to deliver critical research on disaster risk reduction, support state agencies with data analytics and decision-making tools, and generate evidence-based solutions that help Texas communities become more resilient over the long term.

Buyers Aware
Program:
Measuring, Mapping and Managing Flood Risk in Texas
Program:
The IDRT team created an updated tool for identifying flood risk across 14 counties along the Upper Texas coast. Features include: (1) more explanation of how we are using statistical machine learning techniques to identify expected flood impacts based on parcel-level flood damage claims; (2) different return periods/probability of flood events; and (3) a comparison section that allows a user to scroll between traditional physics-based FEMA flood plain designations and our “damage-plain” approach.
Rebuild Texas
Program:
This web-based spatial decision support system for Texas coastal communities is developed and maintained by Center for Texas Beaches and Shores in support for implementing the Rebuild Texas Framework. This spatial visualization, risk communication, and information-sharing mapping interface provides details on major Hurricane Harvey Impacts. The interface also provides general information about local flood risks in the region.
Coastal Bay Atlas
Program:
The Bay Atlas zooms in from the regional level Coastal Atlas, showing finer details within the Galveston Bay and the surrounding counties of Chambers, Galveston, and Harris. New datasets offered in this map set include Digital elevation models, Land Change, Land Cover, Impervious Surface, and Population Density.
Cost/Benefit for Flood Reduction Mitigation Strategies
Program:
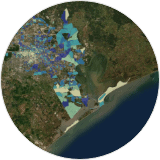
This Cost Benefit Dashboard provides a series or scenarios allowing the user to explore how changing the budget and mitigation practices can affect potential flood reduction. Users can select from elevating properties or buyouts and the map provides insights into expected flood losses and savings from storm surge or inland flooding during storms such as Hurricane Harvey and Hurricane Ike.
Texas Historic Insured Flood Loss Analysis
Program:
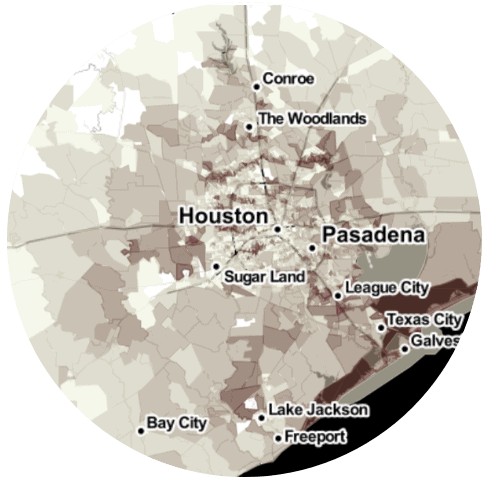
CTBS conducted a statewide analysis of historic insured flood loss to help identify at-risk communities in the state. This tool can help residents and decision makers better understand the history and pattern of insured flood damage across the state. This project is a partnership between multiple Texas universities, state and federal agencies, community leaders, and was funded by the Texas General Land Office and FEMA.
Economic Impacts of Hurricane Storm Surge in Galveston Bay
Program:
This map shows likely property damage to residential structures and associated flood depths for hurricane storm surge in the Houston-Galveston metro area.
Residential damage estimates were calculated using HAZUS damage estimation software and are based on US Army Corps of Engineers’ modeling of water depths for surge events (using ADCIRC software) and equations relating flood depth and property values to expected property damage.

Buyers Be-Where
Program:

Measuring, Mapping and Managing Flood Risk in Texas
Program:
The IDRT team created an updated tool for identifying flood risk across 14 counties along the Upper Texas coast. Features include: (1) more explanation of how we are using statistical machine learning techniques to identify expected flood impacts based on parcel-level flood damage claims; (2) different return periods/probability of flood events; and (3) a comparison section that allows a user to scroll between traditional physics-based FEMA flood plain designations and our “damage-plain” approach.

Rebuild Texas
Program:
This web-based spatial decision support system for Texas coastal communities is developed and maintained by Center for Texas Beaches and Shores in support for implementing the Rebuild Texas Framework. This spatial visualization, risk communication, and information-sharing mapping interface provides details on major Hurricane Harvey Impacts. The interface also provides general information about local flood risks in the region.
Coastal Bay Atlas
Program:
The Bay Atlas zooms in from the regional level Coastal Atlas, showing finer details within the Galveston Bay and the surrounding counties of Chambers, Galveston, and Harris. New datasets offered in this map set include Digital elevation models, Land Change, Land Cover, Impervious Surface, and Population Density.

Cost/Benefit for Flood Reduction Mitigation Strategies
Program:
This Cost Benefit Dashboard provides a series or scenarios allowing the user to explore how changing the budget and mitigation practices can affect potential flood reduction. Users can select from elevating properties or buyouts and the map provides insights into expected flood losses and savings from storm surge or inland flooding during storms such as Hurricane Harvey and Hurricane Ike.

Texas Historic Insured Flood Loss Analysis
Program:
Economic Impacts of Hurricane Storm Surge in Galveston Bay
Program:
This map shows likely property damage to residential structures and associated flood depths for hurricane storm surge in the Houston-Galveston metro area.
Residential damage estimates were calculated using HAZUS damage estimation software and are based on US Army Corps of Engineers’ modeling of water depths for surge events (using ADCIRC software) and equations relating flood depth and property values to expected property damage.
Galveston Bay Estuary: Status and Trends
Program:
The Status and Trends is a collection of spatial and temporal indicators including water quality, oil spills, metals, organics, birds, and fisheries catch per unit effort. This data is obtained from the Texas Commission on Environmental Quality, Texas Parks and Wildlife Department, General Land Office, and Audubon Texas, with the funding for this project provided by the Galveston Bay Estuary Program. The spatial extent of this atlas is the Galveston Bay Estuary as defined by the National Estuary Program.

